Overview
The Goal
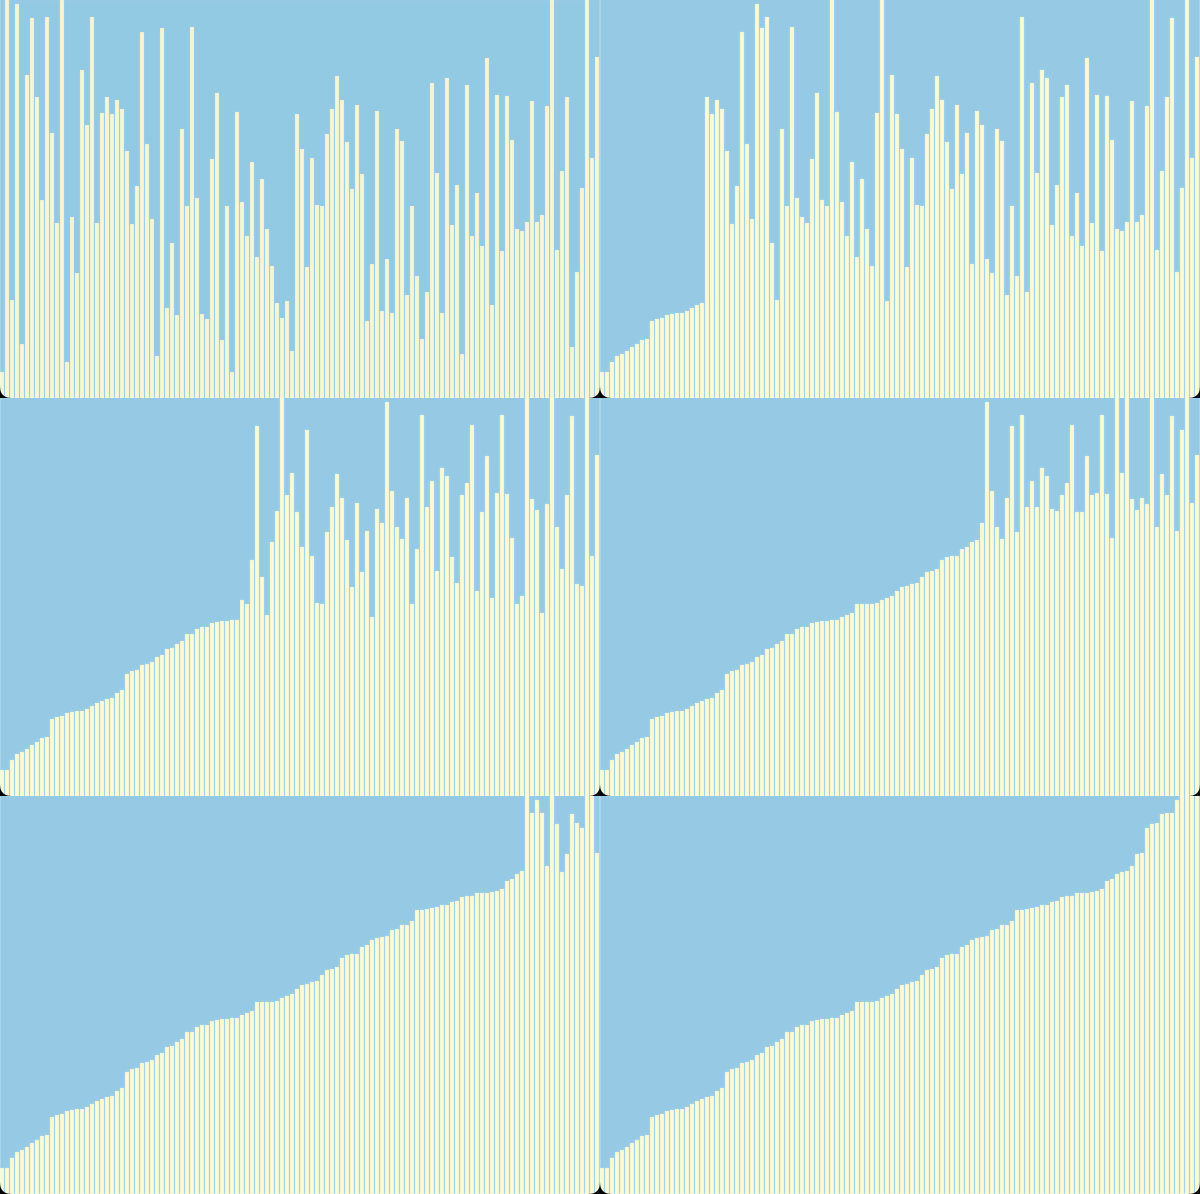
Now that you’re warmed up, we’re ready to begin building our sorting visualizer. Here’s an example of what it will look like when we’re finished:

Example Goal: Selection Sort Visualization
The Plan
Getting this working will take some time and effort. To help make it manageable, we’ll break the project up into the following high-level steps:
- Create a
DataSetclass to contain the data we’re going to sort. At first, to keep things simple, there will be no visual component other than the text output in the terminal. Once we have some basic functionality in place we’ll come back to add the graphics. - Get our text-based visualization working for Selection Sort and Insertion Sort.
- Create a
Menuclass and use it to make a simple user interface that allows the user to choose which sort they would like to run. - Create a
VisualDataSetclass that inherits from ourDataSetclass, but overrides thedisplaymethod to produce a visual representation of itself using thepicturemodule. If all goes well, substituting theVisualDataSetfor theDataSetclass should result in a working graphical visualization like the one shown above. At this point we’ll add a menu option to allow the user to choose betweenVisualDataSetandDataSet. - Finally, we’ll implement Bubble Sort and add this to our menu.
The steps above will take you to the end of the required part of the lab. Once they are complete, you’ll have a program that allows the user to choose between text-based and graphical visualizations of 3 classic sorting algorithms.
Caution: sorted is off limits!
In previous labs, you have sometimes been allowed to use the Python built-in function sorted. In this lab, it is prohibited, since the goal is learning to implement sorts and related functions yourself. This restriction applies to all parts of the final lab.
Extra Credit
In keeping with CSCI 150 tradition, there are extra credit opportunities available once you’ve completed the required steps above. The various options are described in the Extra Credit page before the Wrap Up.